

Chrome Devtool
The Micro-frontend architecture differs from the traditional monolithic application development model. Its characteristics of separate development, deployment, and debugging require a new set of debugging tools to meet new usage scenarios, such as: how to verify the effect of modules in actual projects during Module Federation development, whether the dependencies of Module Federation are reused with the host environment, which Module Federation modules are loaded on the current page, the dependency relationships of Module Federation, and how data flows between Module Federation modules.
Chrome Devtool provides the following capabilities:
- Supports
Module Federationproxy function, proxying online pageModule Federationto user localModule Federation. - Switch online page
Module Federationversions for quick functional verification. - Support viewing module dependency information.
- Support filtering specified module dependency information.
- Support Loading Trace for remote, shared, component-ready signals, and failure reports.
You must use mf-manifest.json to use the visualization and proxy capabilities provided by Chrome devtool.
Usage Scenarios
DevTools provides multiple functional panels suitable for different debugging needs in development and production environments:
-
Proxy: Used to proxy modules from online or test environments to the local development environment.
- Supports local service port numbers, e.g., key: appA -> value:
http://localhost:3000/mf-manifest.json, the page will directly loadModule Federationcontent from port 3000. - Supports using
mf-manifest.jsonfile address format, e.g., key: appA -> value:https://xxx/static/mf-manifest.json, the page will directly loadModule Federationcontent from the specified address.
- Supports local service port numbers, e.g., key: appA -> value:
-
Module Info: Used to view detailed information of all Federation modules loaded on the current page, including version, entry address, etc.
-
Dependency Graph: Visually displays the dependency reference relationships between modules, helping to clarify complex micro-frontend architectures.
-
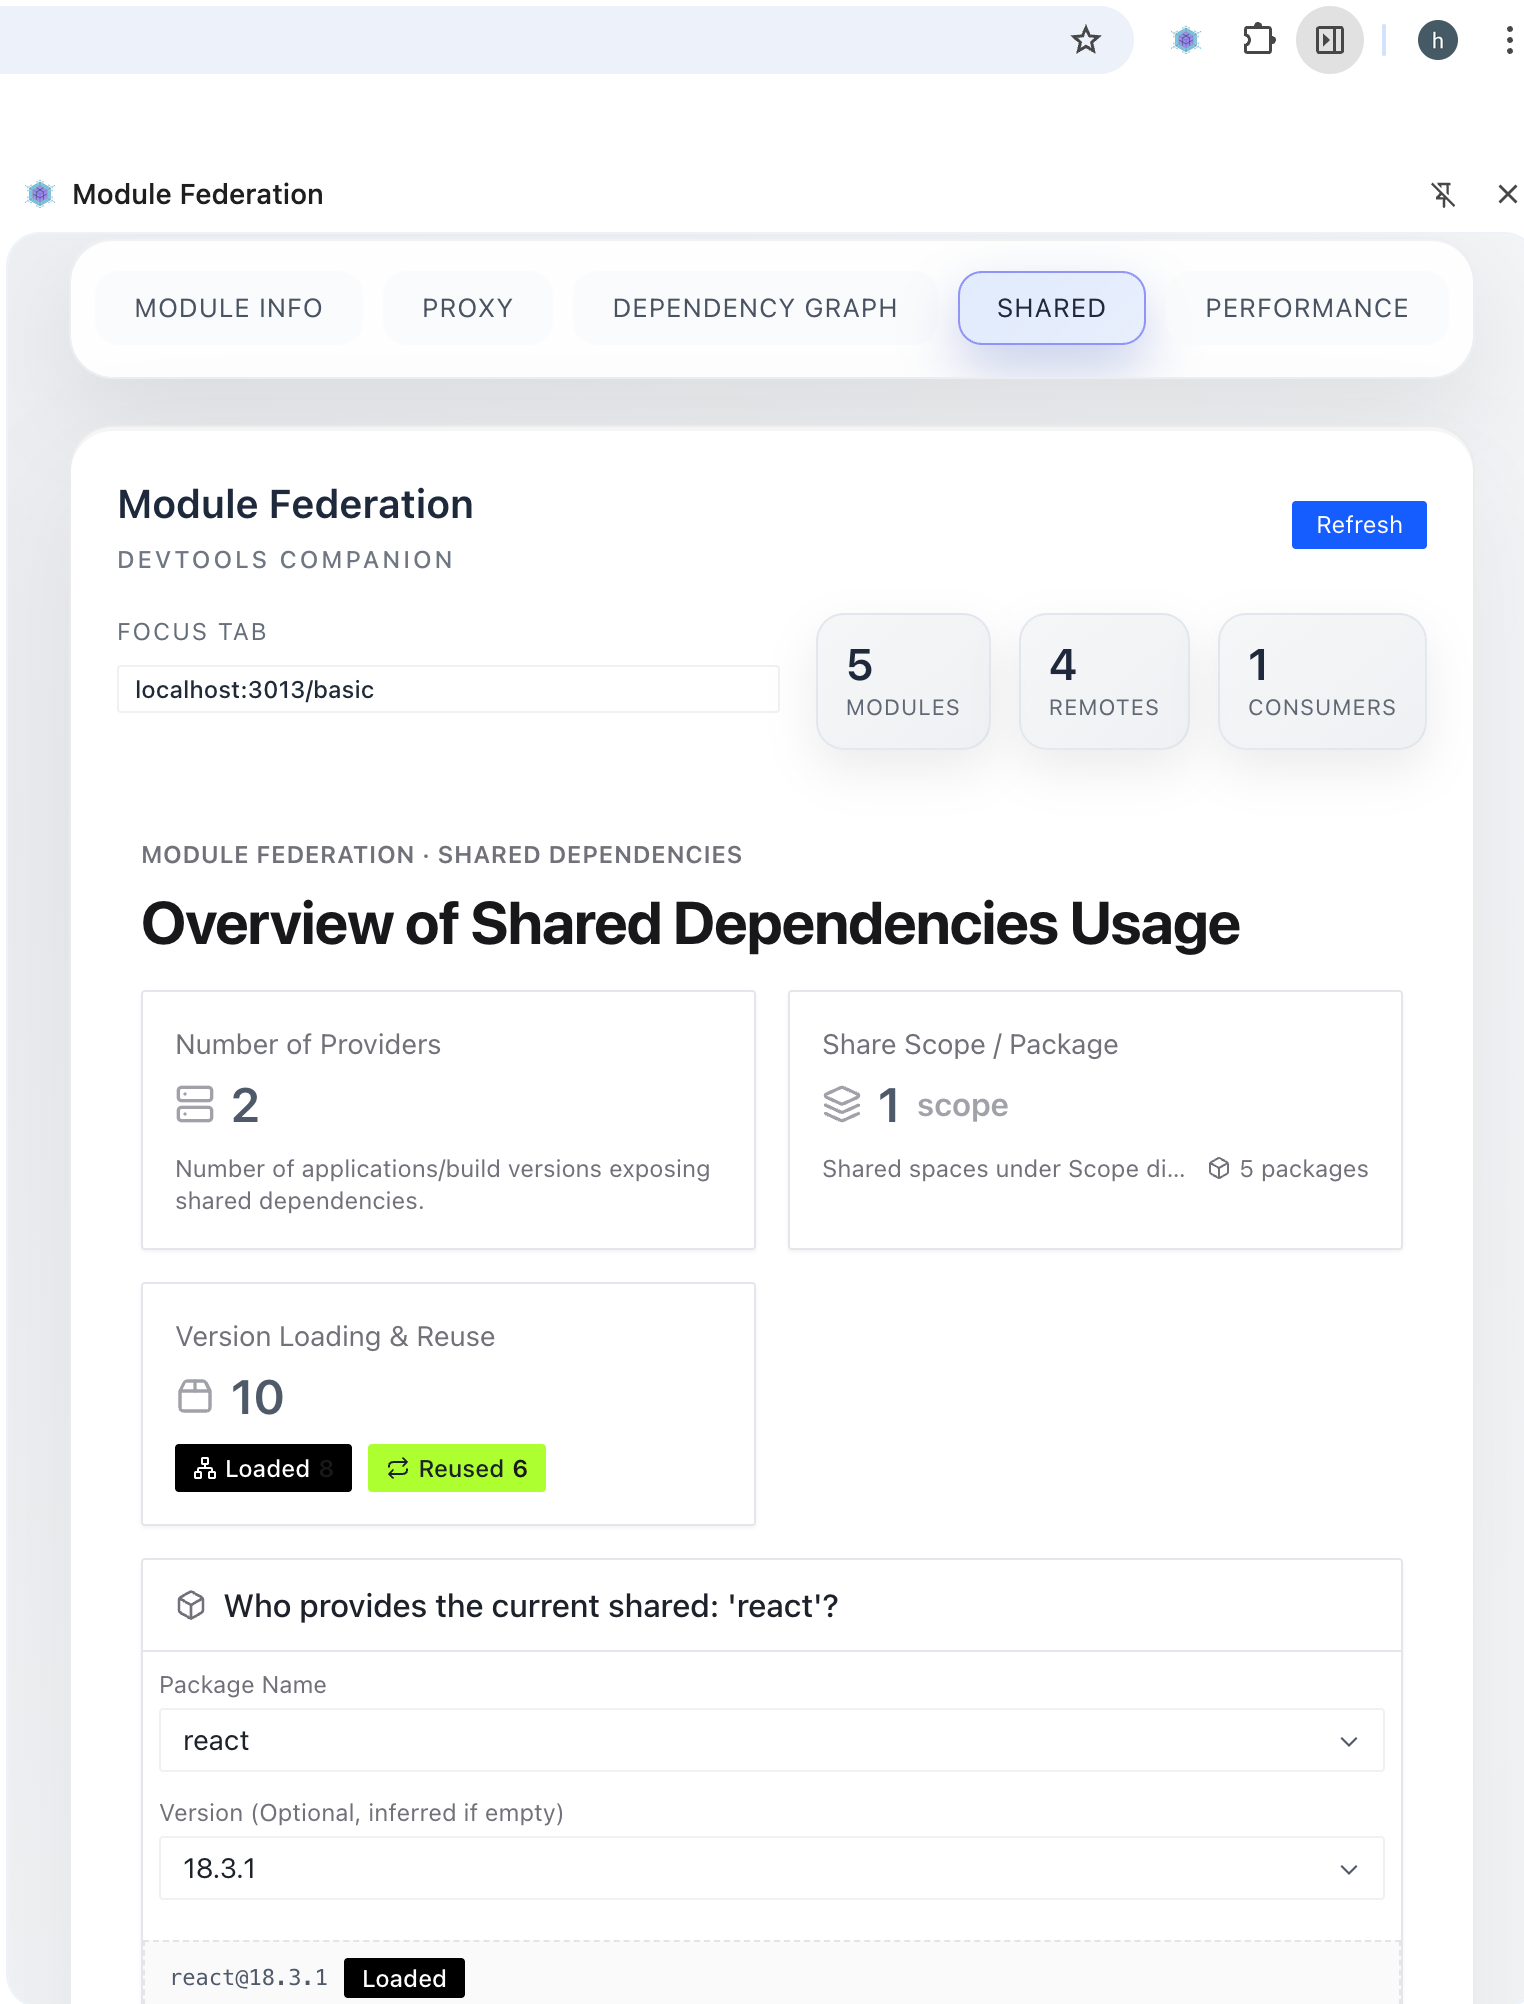
Shared: In-depth analysis of Shared Dependencies usage.
- View loaded and unloaded shared dependencies.
- Analyze version reuse of shared dependencies (Loaded / Reused).
- Check the effective status of configurations such as Singleton and Strict Version.
-
Loading Trace: Records Module Federation loading on the current page.
- Inspect
loadRemoteandloadSharestart, success, failure, and recovery states. - See which consumer loaded which remote and expose, and which shared provider/version was selected.
- If the page already uses the Observability Plugin, the panel reads those reports and shows
CUSTOM. - If the page does not use the plugin, click
Observe nowto temporarily inject the Chrome collection plugin for the current tab.
- Inspect
How to Install
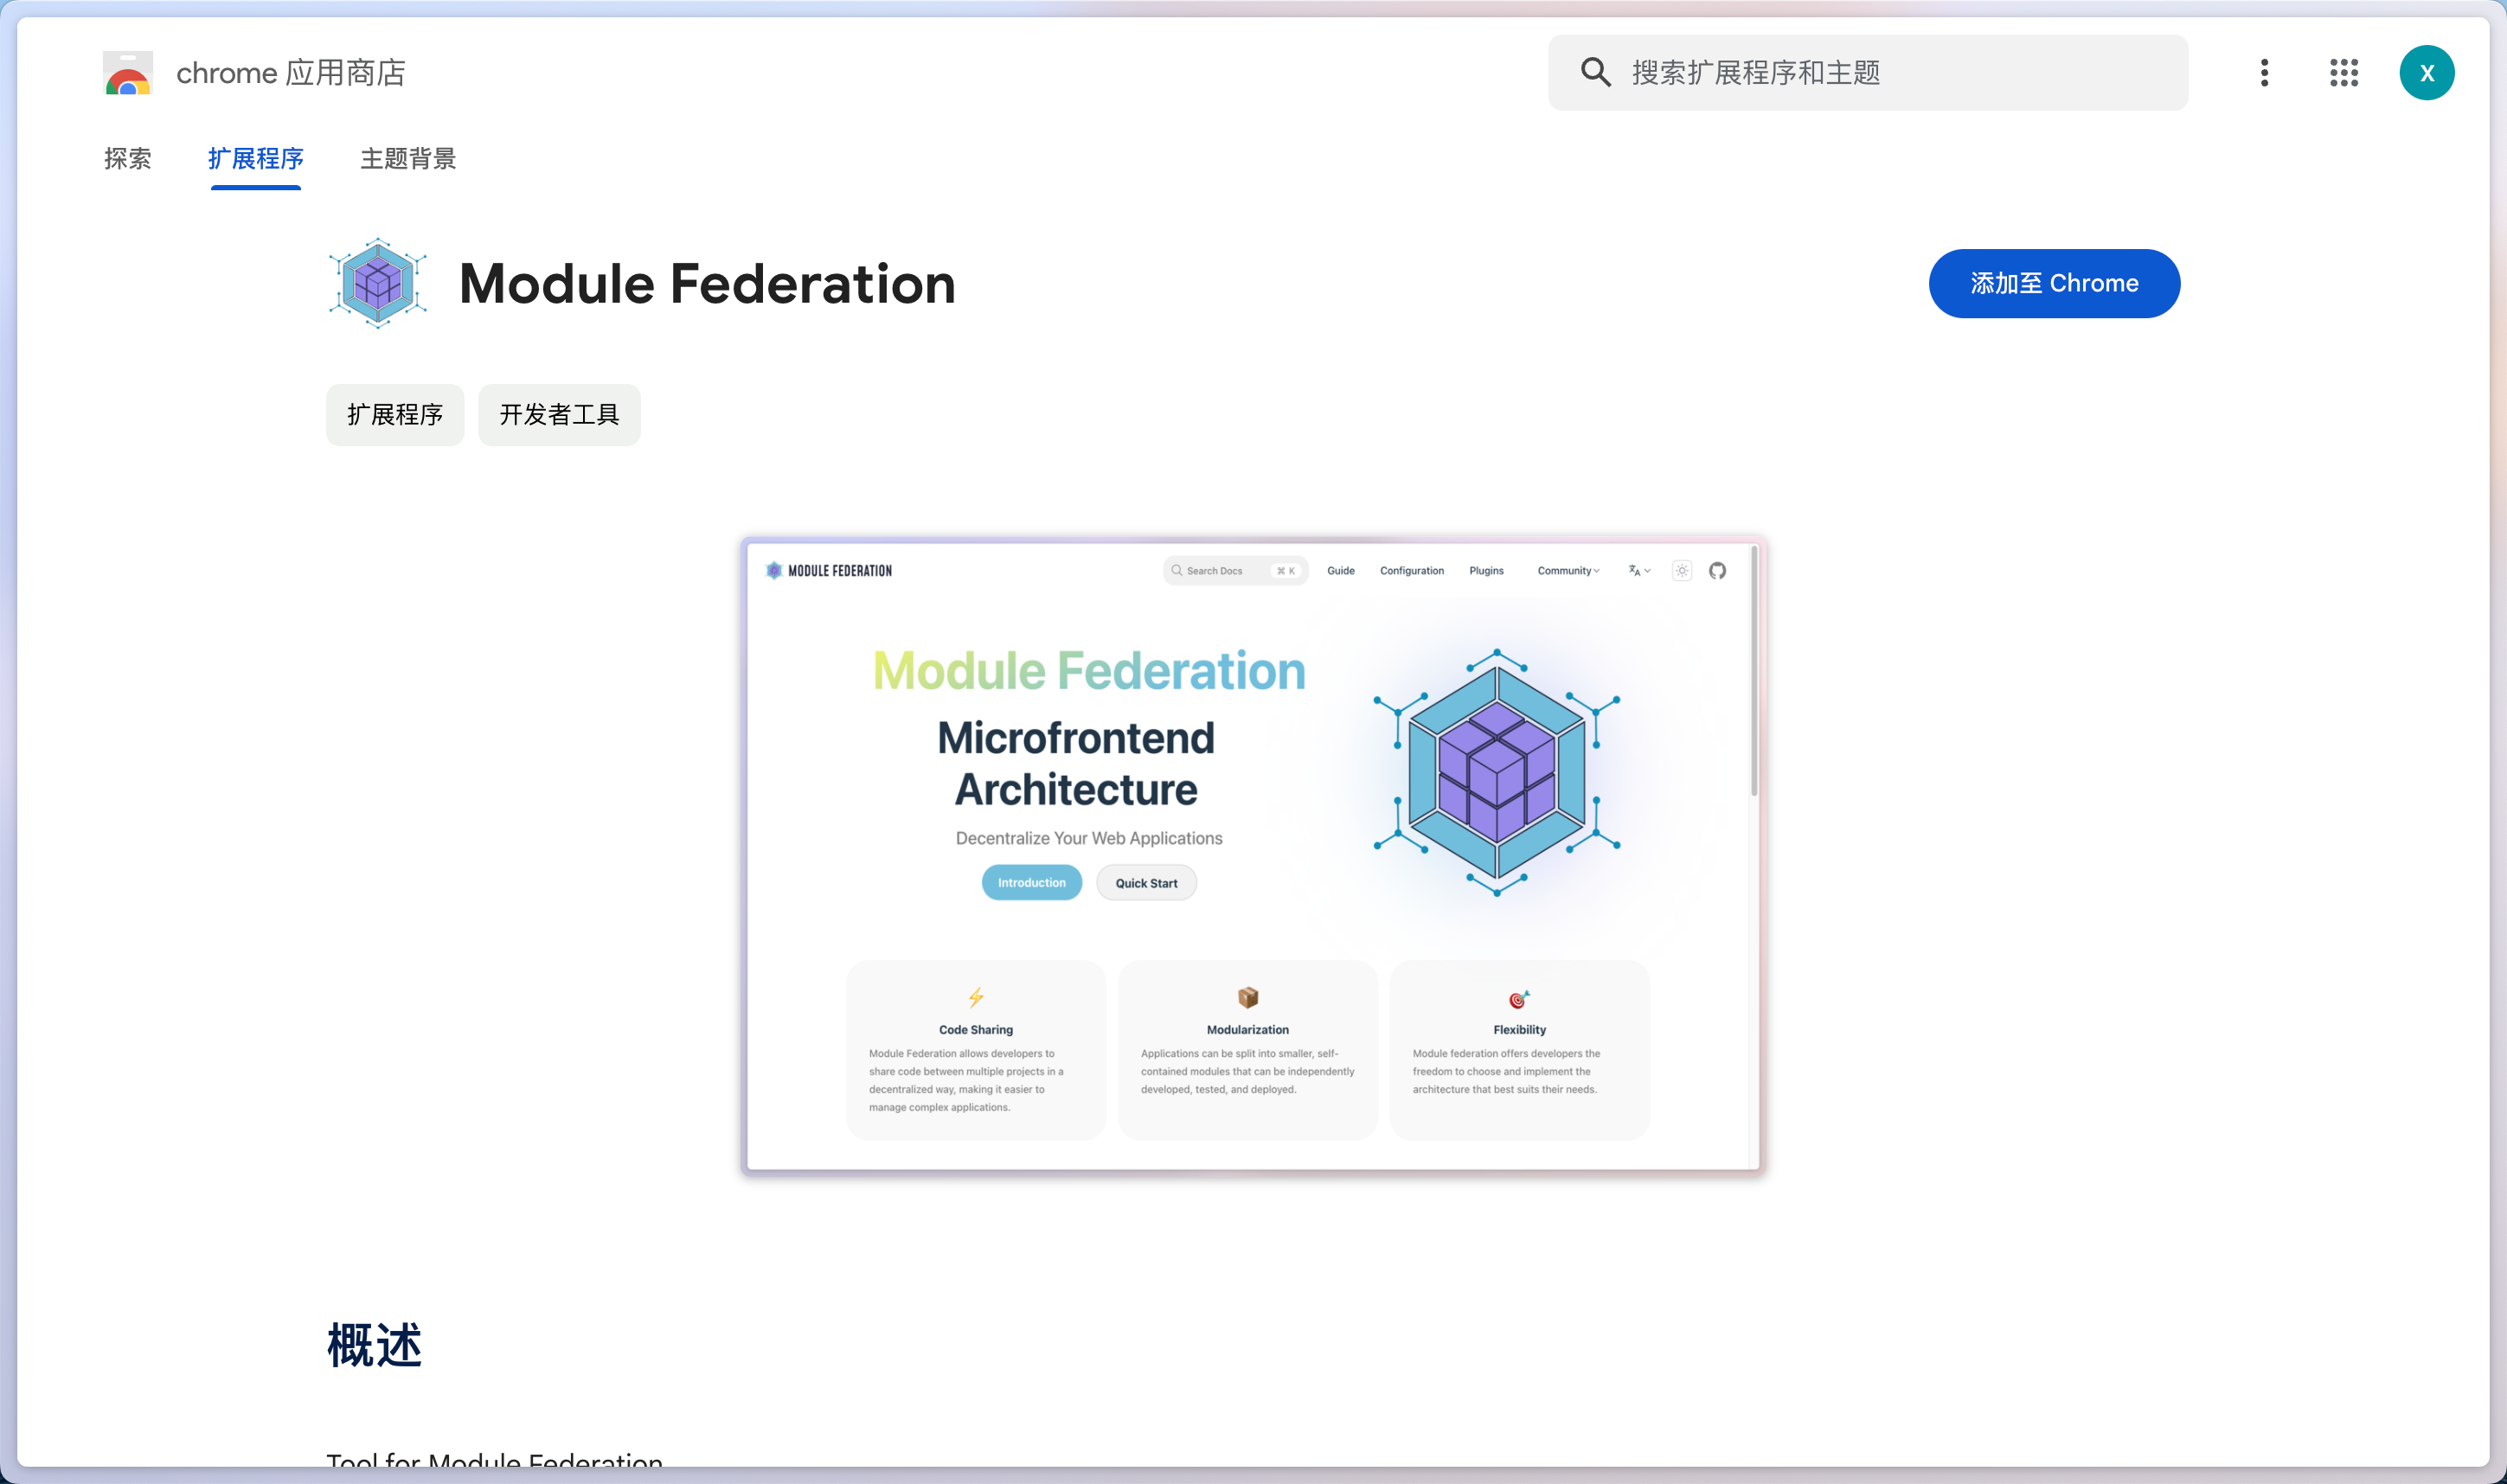
- Open the Module Federation Plugin Details Page, click the
Add to Chromebutton.
How to Use
The plugin provides a Devtools panel.
- F12 open developer tools, select click
Module Federationtab, enter the proxy page, and you can debug the dependent modules.
Overall Interaction
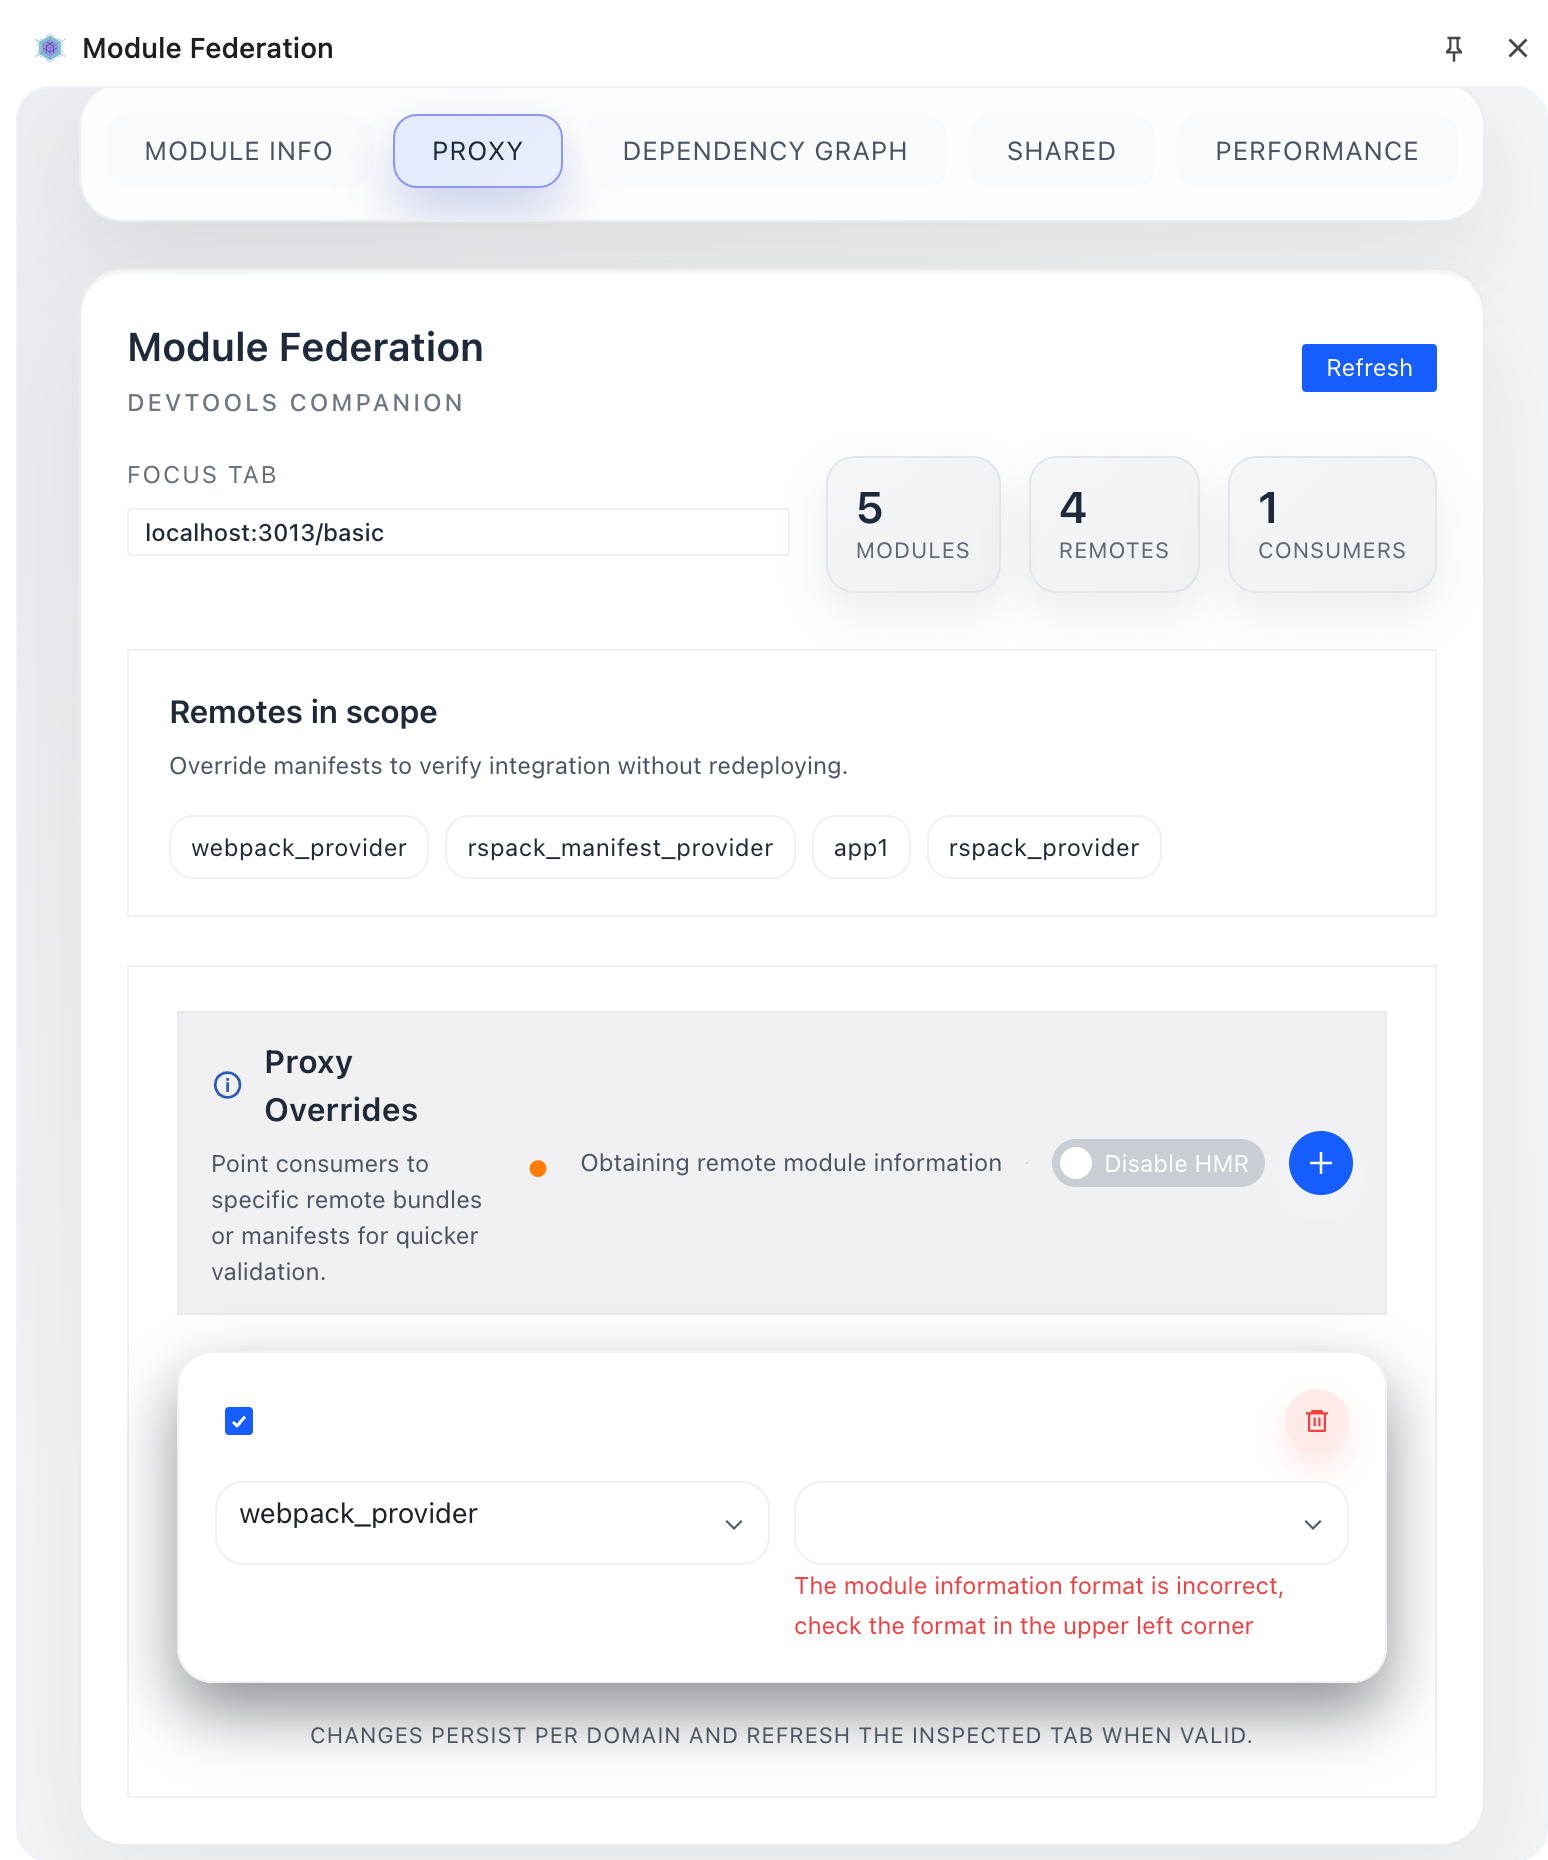
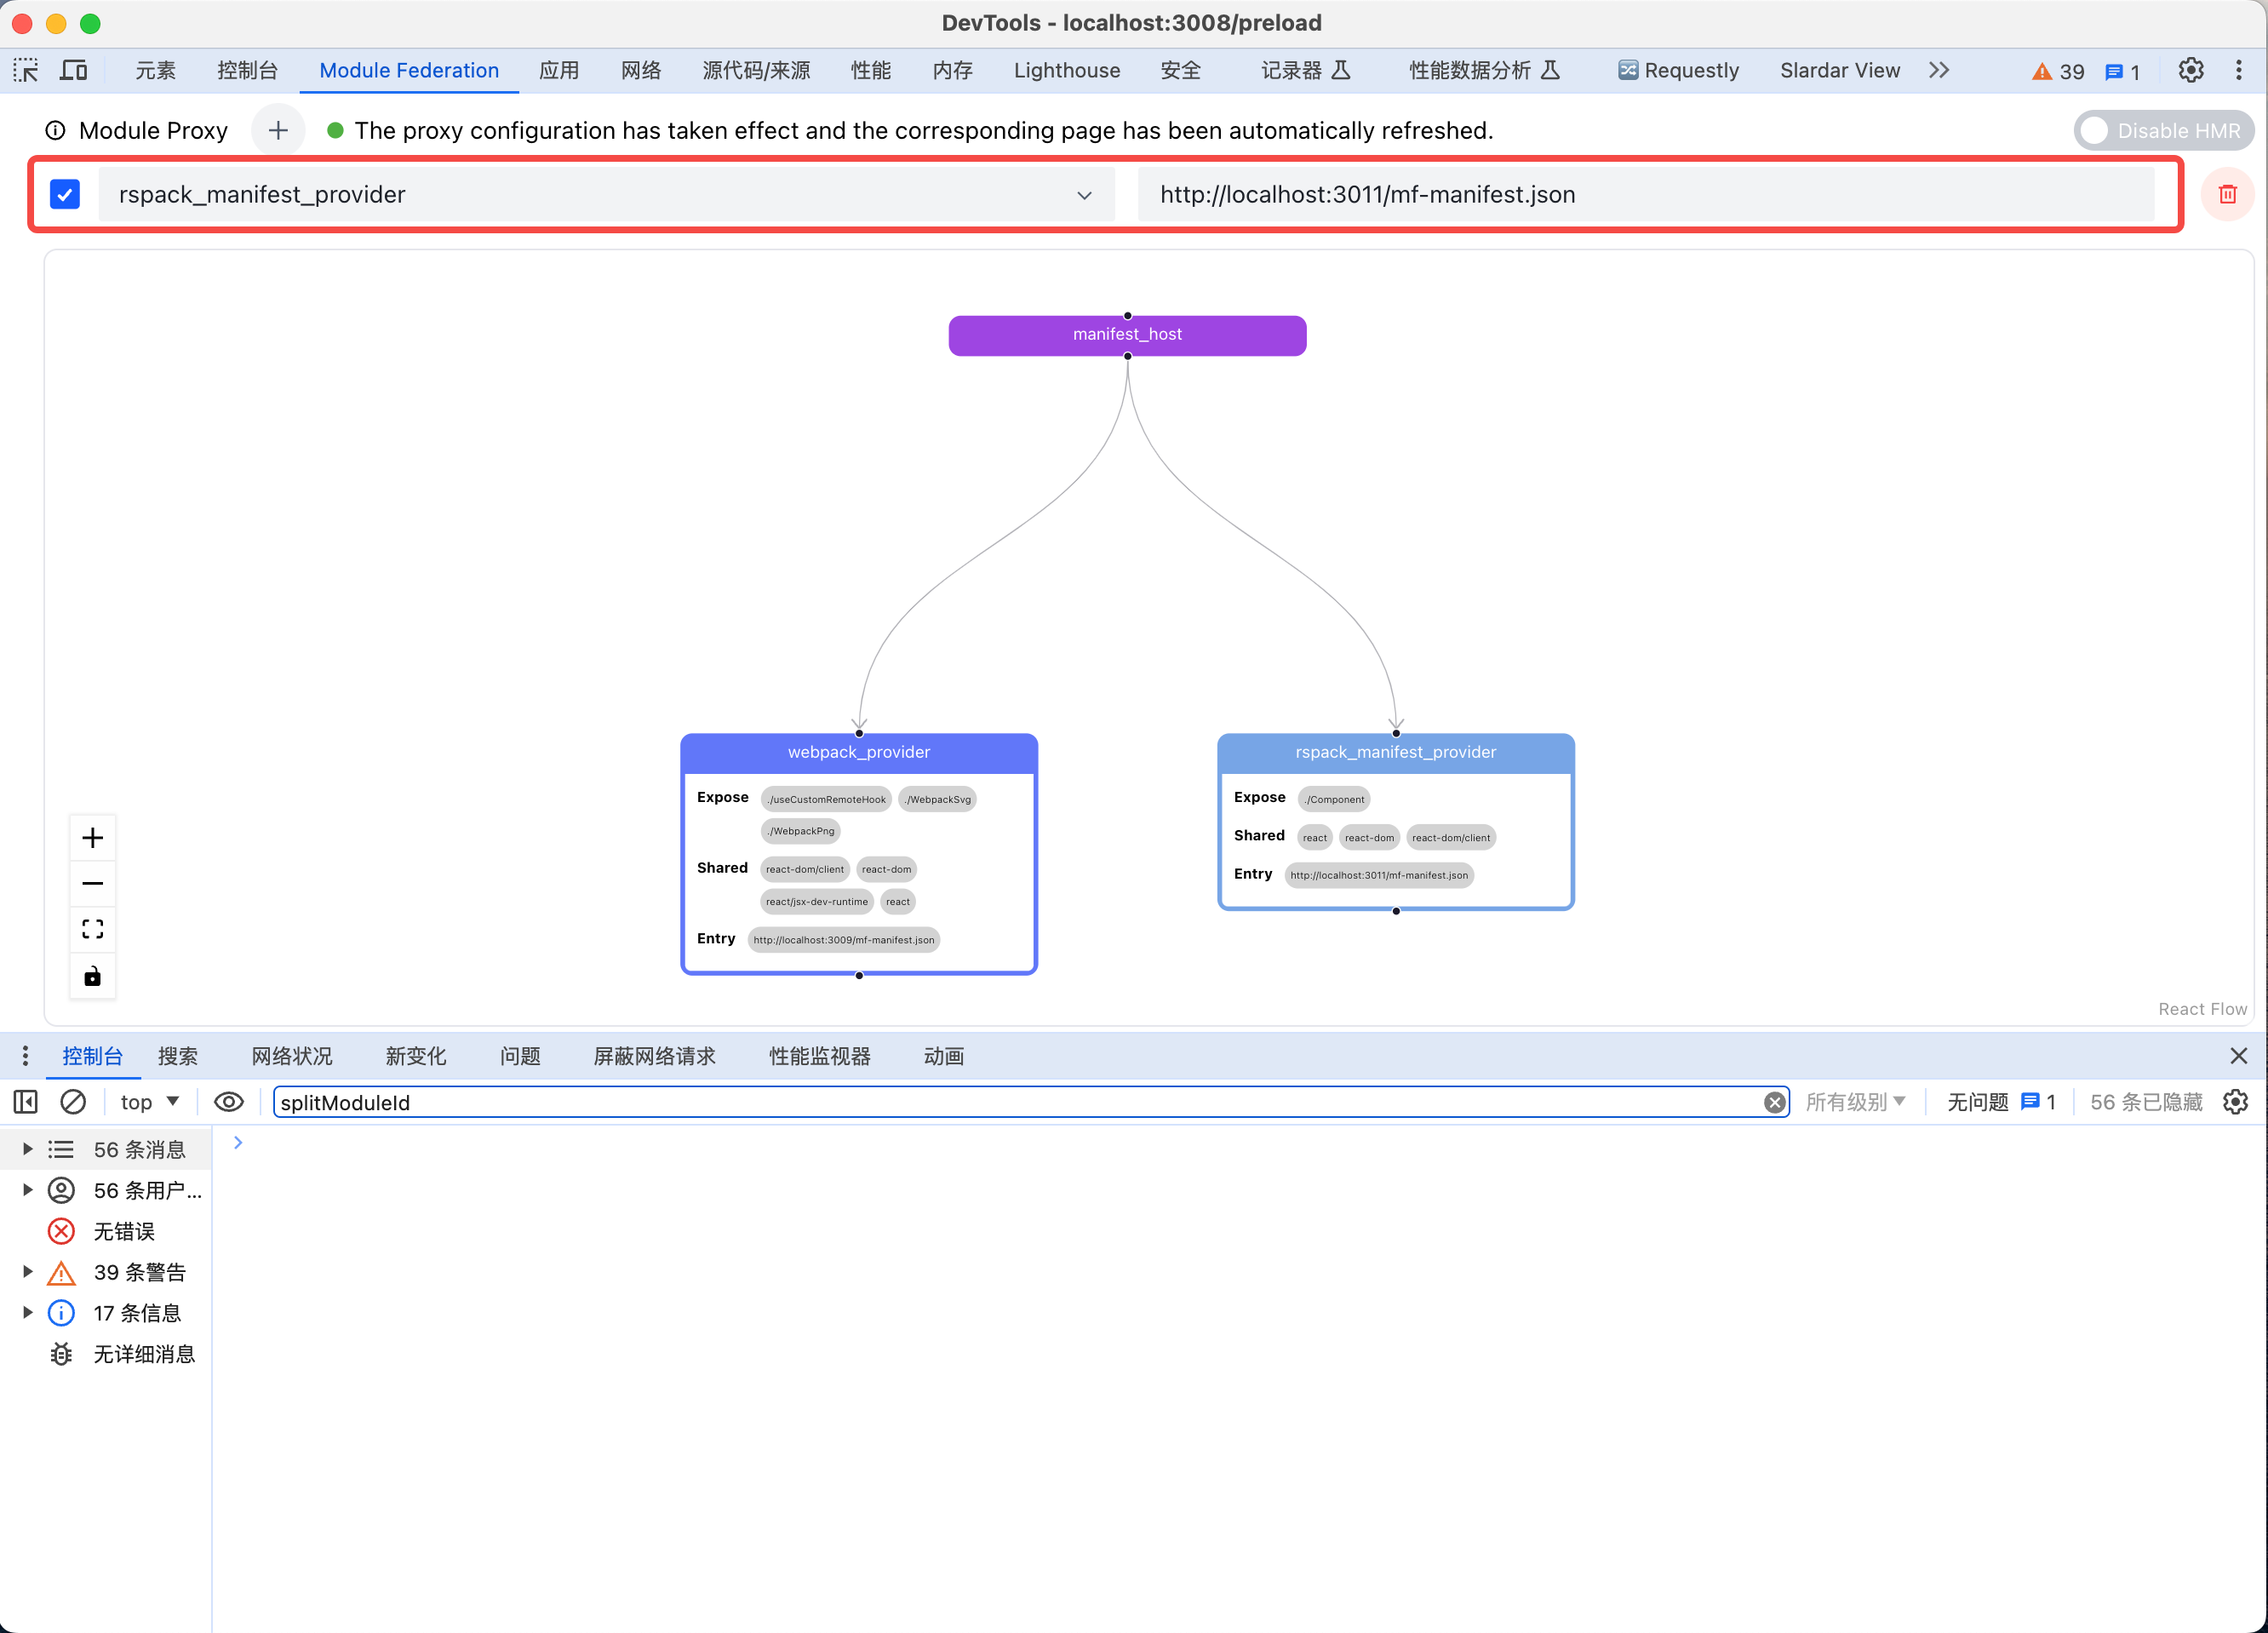
As shown below, the proxy page provides options such as add new proxy module, producer selector, version or local port or custom entry, etc.
- Select a module that the target page needs to proxy by selecting
producer selector; - Select or enter the specified address (including port number and address ending with
mf-manifest.json) throughversion or local portfor proxy operation; - If you need to proxy multiple modules at the same time, click the
add new proxy modulearea to add the corresponding proxy module. - Support Multi-Tab Isolation: When opening pages using Module Federation in multiple tabs simultaneously, the proxy rules and module information of each tab are independent. Proxy rules set in Tab A will not affect Tab B, and vice versa. This allows you to debug multiple environments or application states simultaneously.
Loading Trace
The Loading Trace tab answers what actually happened during Module Federation loading. Use it when the page is blank, a component stays in loading, shared versions are unclear, or a producer fails intermittently.
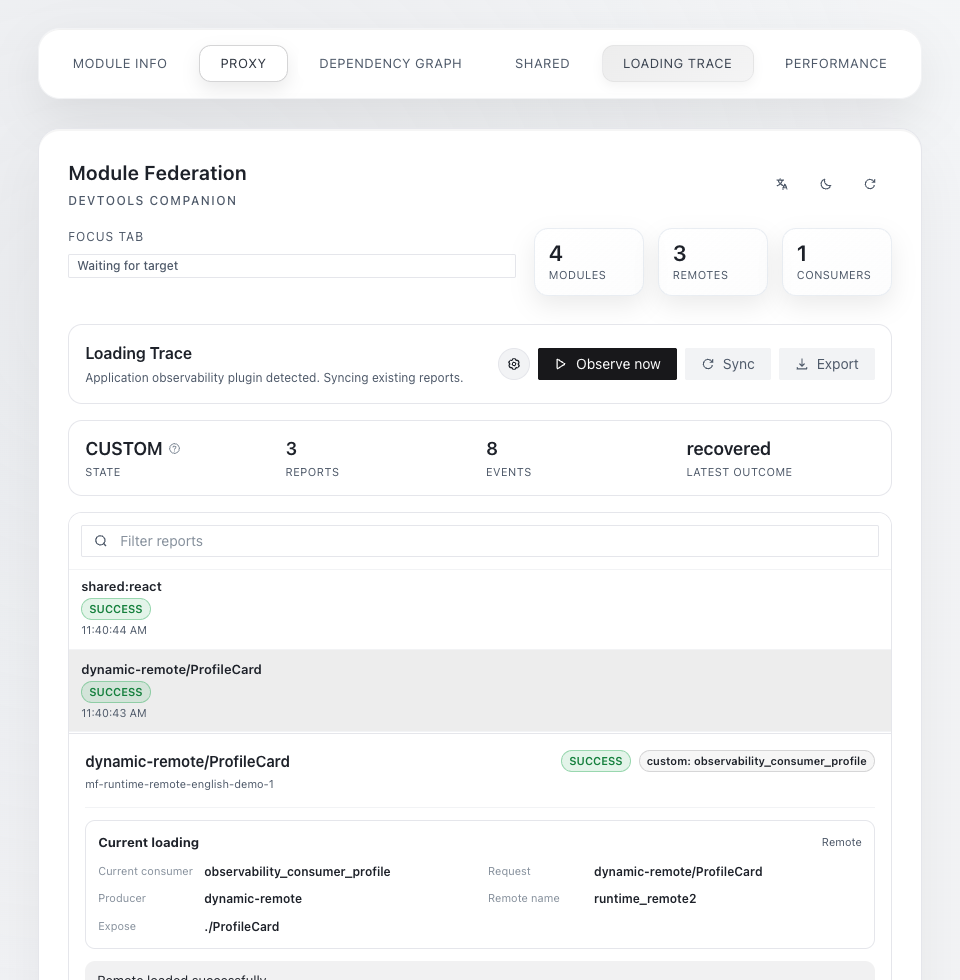
The top status means:
OFF: no readable loading report has been found on the current page.ON: Chrome collection is enabled for the current tab.CUSTOM: the inspected page already registered its own observability plugin, and DevTools is reading those reports.
Common workflow:
- Open the target page.
- Open Chrome DevTools and choose the
Module Federationpanel. - Open
Loading Trace. - If the status is
OFF, clickObserve now. The page reloads once. - Reproduce the issue or trigger the remote component load you want to inspect.
- Select a report and inspect current loading, previous loading records, the event timeline, and troubleshooting suggestions.
- Click
Exportto save the full report.
Report states:
Success: the MF chain completed. Remote reports show the remote result; shared reports show the selected provider and version.Failed: the chain failed. Start from the failed phase, error code, and suggested actions.Pending: a start event was recorded, but no completion, failure, or recovery event was seen yet.Recovered: loading hit a problem first, then continued through fallback or recovery.Basic observability: the runtime version is too low or cannot be detected, so detailed phases may be missing.
Analyze an exported report
The exported JSON contains config, scopes, and reports. For each report, start with:
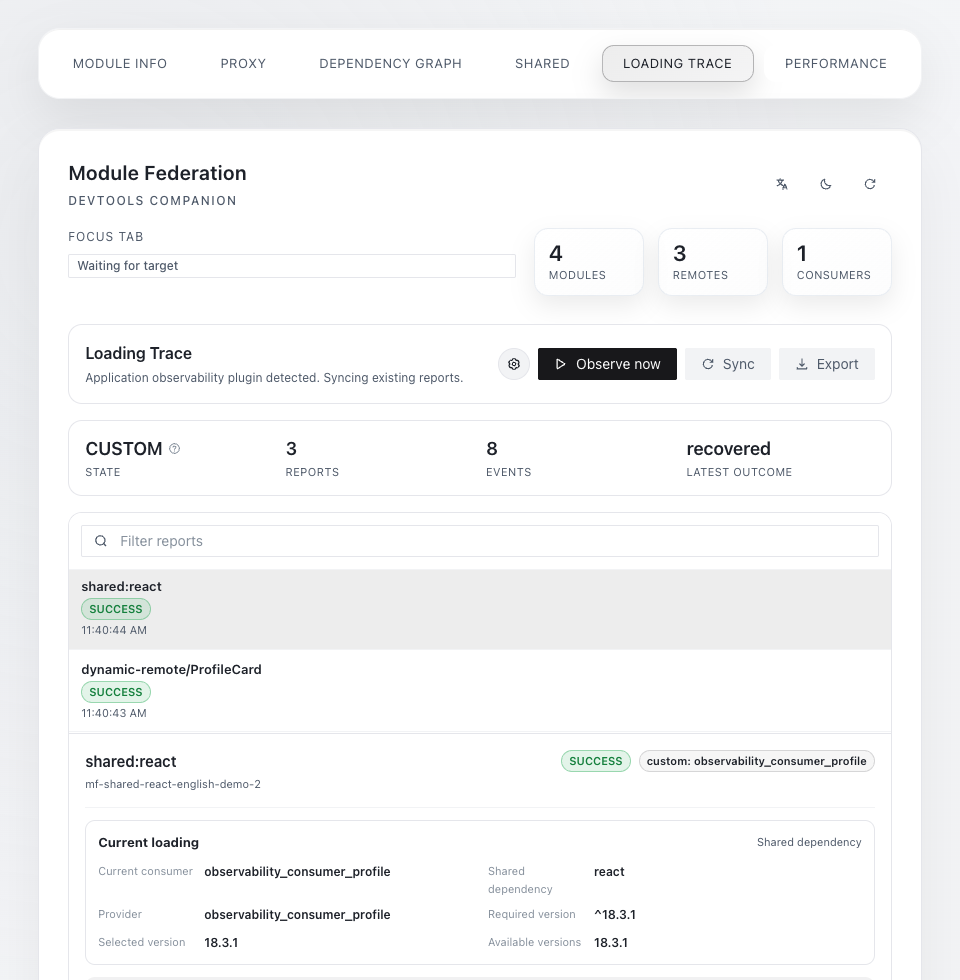
diagnosis: the troubleshooting conclusion, facts, and next actions.summary: the final state, such asruntime-loaded,component-loaded,shared-resolved,failed,recovered, orpending.remote/shared: what was loaded. For shared reports, inspect provider, required version, selected version, and available versions.loadedBefore: whether the same producer had already been loaded by another consumer.events: the ordered timeline, useful for finding the phase that got stuck.
You can give the exported report directly to an AI coding agent:
How to Proxy Locally Developed Modules to Online
- First, you need to start the producer locally.

- Then enter the successful manifest address into the version selection input box on the proxy page.
- Afterward, adjust the local producer code, and the consumer page will automatically Reload.
FAQ
Does it support multi-tab isolation debugging?
Yes, when you debug with multiple tabs open simultaneously, the Chrome DevTool plugin automatically identifies the current active tab and stores the proxy rules for each tab in isolation.
- Independent Storage: Proxy configuration for Tab A only affects Tab A. After switching to Tab B, the panel automatically loads Tab B's configuration.
- State Persistence: Even if multiple tabs load the same URL, their proxy states are physically isolated and do not interfere with each other.
- Automatic Switching: Clicking the "Focus Tab" tag in DevTools confirms the target page currently being debugged.
When does the configuration take effect?
- ✅ Matches verification rules
- ✅ Configuration rule is checked
- ✅ Configuration filled in correctly, page displays: Proxy configuration has taken effect, remote module obtained successfully, corresponding page has been automatically refreshed.
Partial configuration matches rules
The plugin will filter out modules that match the configuration rules for proxying.